
RECENT UPDATES
Weather November 2023
Watts up ? November 2023
Blog 13 June
Contesting 22 May
For Sale 20 May
EME listing 22 March
70cms updated Feb '15
Kits Jan 2015
Yagis and SWR Jan 2015
Yagis and swr PART 1
From time to time, most of us check the SWR of our aerial(s). It can be used to provide confidence that it hasn’t fallen apart during a recent storm, or deteriorated due to water ingress. These quick checks are useful but there’s far, far more that can be learnt by observing and recording the SWR of an aerial, as I hope to demonstrate.
To begin, lets take a step back and consider a VHF yagi – what do we want it to have ?
- good gain
- good SWR
- stable SWR that is weather independent
- low level side lobes and good front to back ratio
- mechanical integrity
- low weight
- low wind loading
- minimal visual impact
- ease of construction
- use of easily available materials
- acceptable cost
I thought hard about putting these criteria into an order of importance, but we would all take a different view, and that view would probably change in the course of time. Readers can make their own priority list.
Some of these criteria are conflicting – an easy example to understand is that low weight might be achieved at the expense of mechanical integrity.
There is also a difficulty in measuring, for example, gain – it is notoriously awkward, even for professionals. That’s one reason why this article focuses on SWR – most of us have a meter that measures forward and reflected power and will directly or indirectly allow us to find the SWR.
Let’s assume (correctly as it happens) that I have just built a nice shiny new yagi and I want to check the SWR. I have a transmitter and an SWR meter or bridge, so I dial up my favourite frequency, transmit briefly, observe the SWR and find that it is 1.2 to 1. That’s quite a good result; the designer said it would be better that 1.5 to 1 so I’m happy and it’s job done.
No, it is not “job done”, not by a long way.
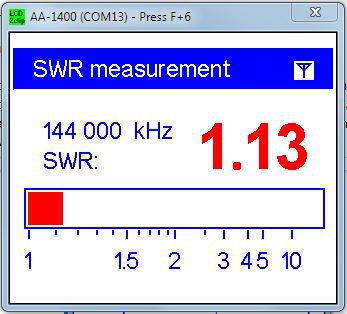
It’s far better to look at the SWR at a number of frequencies in the amateur band which the aerial covers. This can be done by making readings and recording the results in a table and graph. Or with an antenna analyser, some will record a graph across a predetermined frequency range at the press of a few buttons. The sort of graph that can be obtained is shown below.

The aerial has been tested for use on the 2m band and shows a low and almost constant SWR across the entire band. This is often described as a flat response. This still doesn’t tell the complete story, and this is where the antenna analyser becomes particularly useful because we can use it to look at the SWR outside the amateur band. The reason we should do this will become clear quite soon.
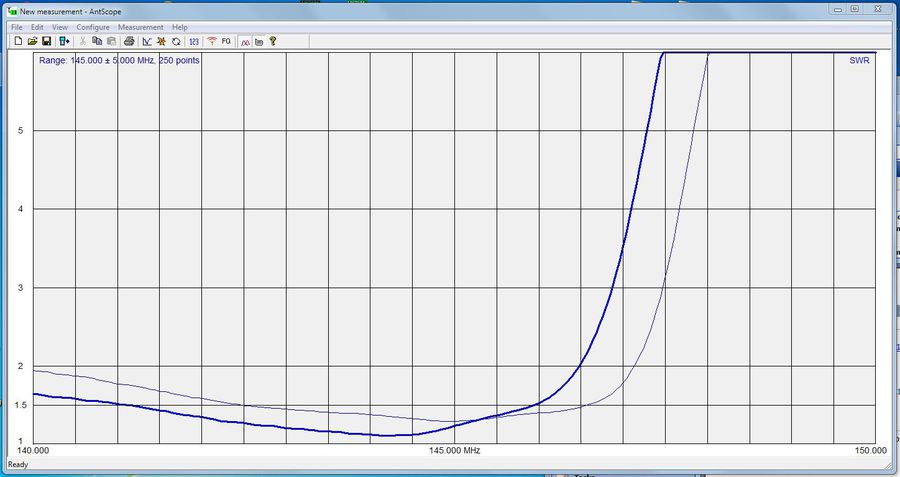
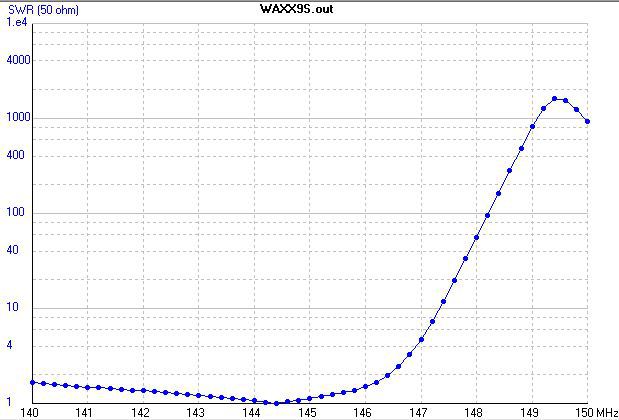
So let’s look at the same aerial, and sweep the analyser from say, 140 to 150MHz. This, by the way, highlights the benefit of an analyser – you can test on any frequency you like. The picture below shows the result, and it can be seen clearly that just above 146MHz, the SWR begins to rise increasingly quickly. This factor would be missed if the analysis stopped at the end of the amateur band. Perhaps you’re ahead of me here – one reason this could be important is if you’re thinking about using the new 146 to 147MHz allocation.

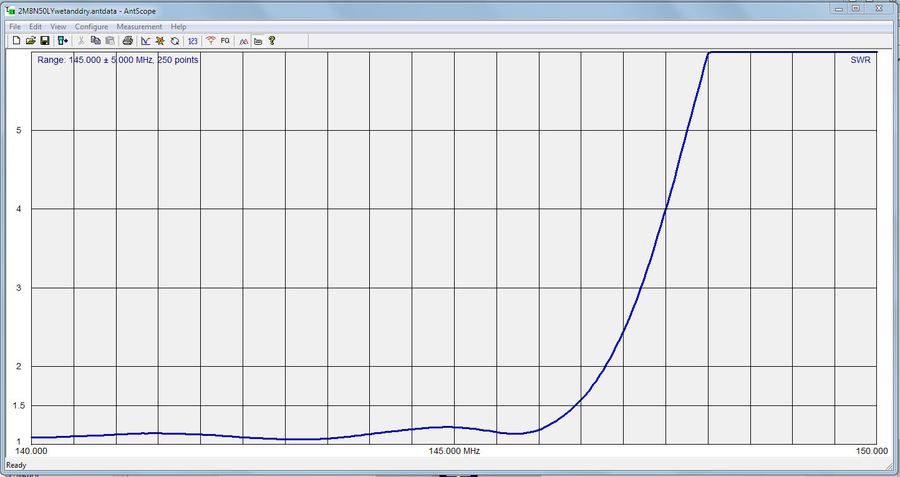
But there’s more. Some amateurs have noticed that their SWR changes when the aerial gets wet or is covered in frost. That can be observed with a spot frequency check, but a better understanding can again be obtained with a wide sweep. Here’s a plot of SWR measured twice on the same aerial, one indicating the SWR when it is dry, and one when it is wet (the bold line). There is a downward frequency shift of the “knee” of the curve when the aerial is wet. In this example it's about 700kHz - that will vary from aerial to aerial. This shift would be completely missed by just making an observation at one frequency such as 144.300MHz. The critical part of this is observing where the knee in the curve has moved to. If it’s got near your working frequency it’s probably too close for comfort. This is an area in which some yagis behave very differently to others. One way to describe the flat part of the plot is to call it the SWR Bandwidth. You could for example, define it as the bandwidth below 1.5 to 1, or below 2 to 1 depending on how conservative you want to be.
When rain falls on yagi elements, the element becomes covered with a thin film of water. It isn’t a uniform film, because a series of drops will form on the underside, and as their size increases they will drop off. The thickness of the film and size of drops will also be affected by how windy it is, so it’s quite normal to see small variations in SWR while rainfall appears to be constant. The film of water forms a coating which has a different dielectric constant to air and it is this which affects how the shape of the SWR curve varies across the band in different weather conditions.
From this it follows that a wise choice of aerial is one where a good SWR is achieved above the normal working frequencies, because the shift of the curve is always downwards when it is wet. DX on EME or meteor scatter does not occur only when you have dry weather !
Fortunately, we don’t need to build a suite of different yagis and spend lots of time making measurements. This is good news particularly because nature can be very perverse and if you want it to rain for a test, it will not. Software to model aerials is widely and often freely available. Currently my favourite is 4NEC2, which for me provides a good balance between believable results and complexity of use. From the analysis, plots of predicted SWR can be used to determine whether a design is expected to have a sharp or broad SWR, together with the frequency where the knee will happen. Armed with the dimensions of an aerial, you can determine with experience “virtually” how it is likely to perform. Here’s a software analysis of the SWR of the same aerial which was measured earlier – the shape of the curve is very similar, allowing for differences in the scale of the axes.

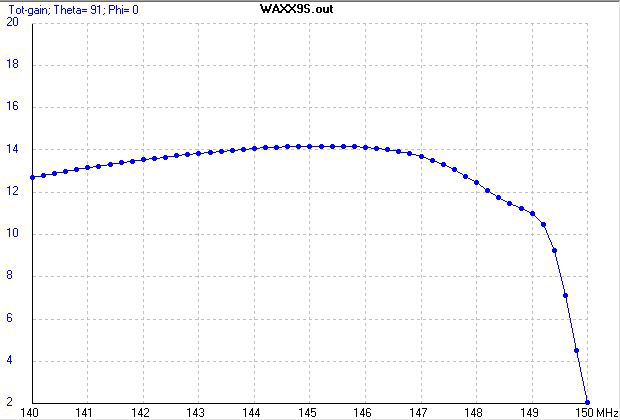
The software can show something else that is very useful – something that is practically impossible for amateurs to measure – it indicates the predicted gain. What is important here is to see how broad and flat the curve is, compared to the fluctuations of the SWR curve. So all is not lost simply because the SWR is high.
A final point about SWR: it does not indicate resonance of the aerial. It indicates a good match between the feeder and the driven element. It does not mean it will radiate well either – remember that a decent dummy load will have a good SWR and that doesn’t radiate at all well.
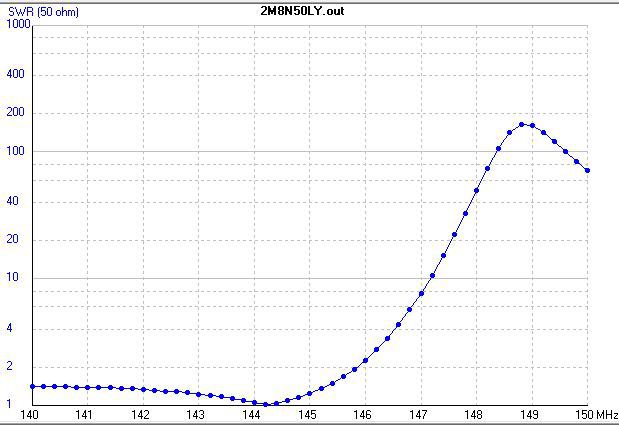
If you’ve followed the discussion so far, this question should be quite easy – the aerials whose SWR is shown below are of a similar size, and gain is equal within 0.4dB. Which one is likely to perform best across all of the 2m band in adverse weather conditions ?
Take care not to get carried away with computer simulations. The software is pretty good, but it’s unable to help you in turning theory into reality. You might fall foul of cutting errors, or find that at UHF getting a driven element spot on is very difficult.
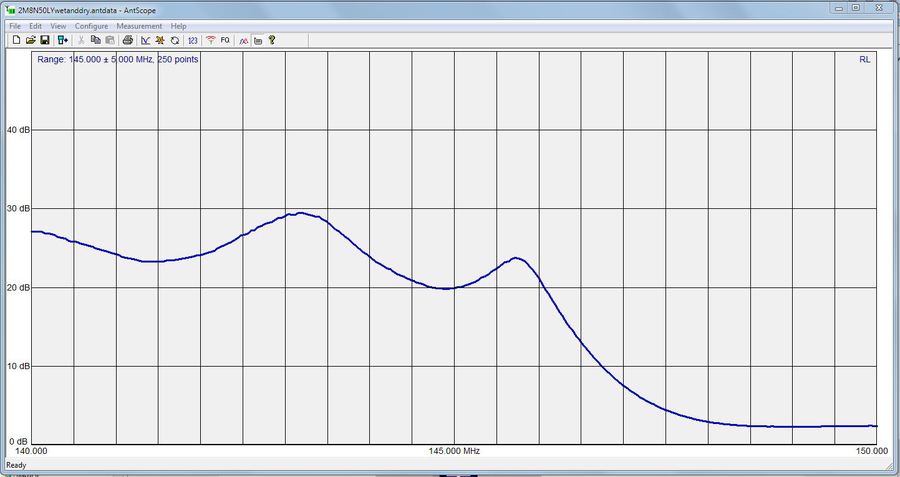
With all this discussion about SWR, what about return loss (RL) ? RL can be thought of as the opposite of SWR, although it’s not quite that simple and often the translation between to two is most easily achieved with a look-up table. The benefit of RL can be demonstrated in the comparison below. The first plot is SWR and the second plot is return loss. When the same data is presented as RL, a more detailed picture of variations becomes evident where the SWR is low, and sometimes “the devil is in the detail”.
Let’s close with a few hints on achieving a suitable environment for initial testing of a yagi. This is particularly useful if the aerial includes a matching device that you want to adjust and see results quickly. Such an initial test is not convenient atop a 60ft Versatower. The yagi should be:-
- Pointing skywards
- Have the reflector at least a half-wave above ground
- Be connected to the test equipment with a short cable that enables the user to be, say at least a wavelength away
- Clear of local obstructions such as other aerials, cables, buildings, metal step ladders and so on
Happily this often places the driven element at a convenient and safe working height.
To recap, it’s a good idea to chose an aerial that has a wide bandwidth of low SWR. This may need to be at the expense of a small decrease in gain. G4CQM has done a lot of design work along these lines, and the aerial used to illustrate this article is his model 2M8N50LY. It’s not one of Dereks most recent designs and further improvements in bandwidth have been made since then. A suite of yagi designs for VHF and UHF is freely available from his web pages. Parts (discrete components or kits) can be supplied by Richard G6HKS. A selection of G4CQM’s designs are marketed by the DX Shop.
Go on – why not build one now and be on the air with it in the spring ? That way, you’ll be well prepared for the British summer !
YAGIS AND SWR PART 2
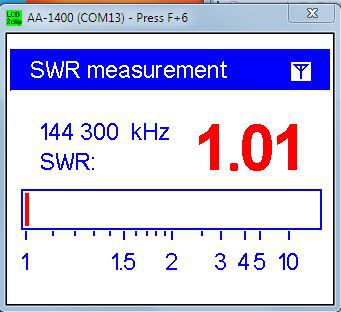
Observant readers will see that the header illustration for Part 2 shows a lower SWR than Part 1. This is relevant !
My fixation with low SWR has continued, and I’ve made good progress with the homemade aerials. I’ve concentrated on achieving a low SWR, and at the same time achieving an SWR pattern which closely matches the NEC prediction. Getting the SWR right means that there is a good expectation that other aerial characteristics, such as gain, will also be on the nose. This is helpful because as I noted earlier, gain is difficult to measure.
My tests ran into an odd situation where I purposely fitted a “wrong” dipole to a yagi, and observed a significant change to the SWR and a change to the frequency at which the best SWR occurred. It was such a big difference compared to predictions that alarm bells started to ring. In addition to changing the dipole I had routed the feeder along the boom slightly differently. It took a while but eventually the penny dropped and I went shopping for some clip-on ferrite clamps, big enough for a single pass over 10mm coaxial cable. At the same time, in discussion with G4CQM, he suggested I might have RF on the outside of the cable. So we had reached the same conclusion at the same time. But, with a different dipole, and re-routing the cable, I had confused the issue with more than one change between tests.
This is an important lesson. If the SWR changes just because the cable is “dressed” differently along the boom, or because of a minor change to the driven element, it could be RF on the feeder.
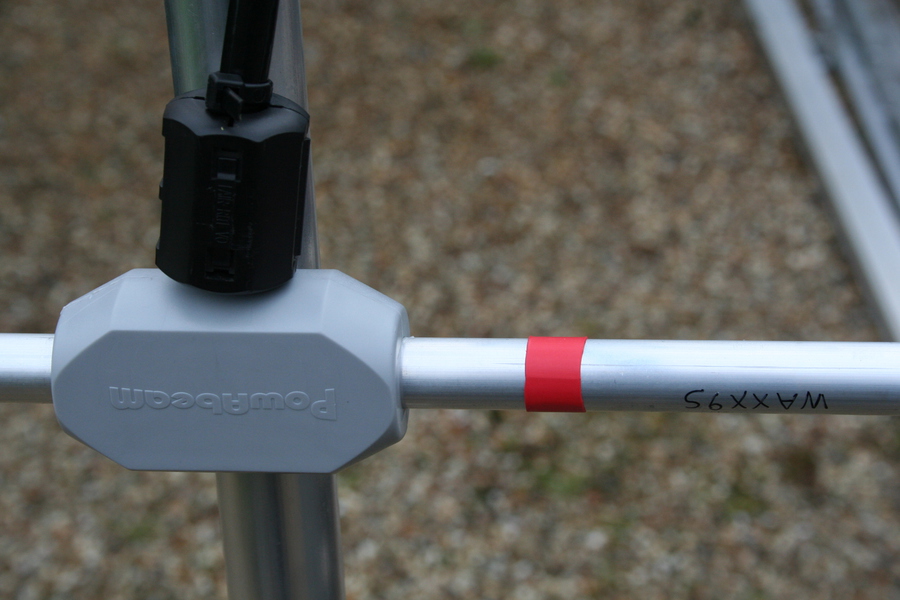
Clip-on ferrites are a great tool and every shack should have a few. The first reason to use these is often to lessen the radiated crud from computer leads, where a good size ferrite can accommodate several turns of a lead. For coaxial cable we usually have to make do with a single pass, and increase the impedance by putting more than one in series. Unless there’s good reason not to, the best place for the ferrite is close to the feed point.

An alternative to the ferrite choke would be a coaxial sleeve. The choke is much easier to install.
Post-script - a 1/4 wave loop also works well - align the feeder well away from the boom for a quarter wavelength (no vf correction is needed) and then tape closely along the boom - see second photo above.
I was advised to use to use Grade 31 ferrite for VHF. I purchased several because each individual situation has to have an individual solution and I had no idea if one or two would be enough. During testing I fitted up to four ferrites, and readings on the antenna analyser showed that one was sufficient. The change of SWR was from around 1.15 down to 1.08 and the point of lowest SWR moved to the centre of the 2m band. It’s a good result and shows again how helpful it can be to look at the SWR reading closely and check it across the band.
Achieving results like this can be a big confidence booster to the home constructor.
On a 70cms yagi, where I also suspected RF on the feeder I made careful notes of SWR with different numbers of ferrites and the results were far more subtle. Starting from no ferrite and ending with three, the incremental readings were1.32, 1.30, 1.27 and 1.25. This demonstrates two things; firstly that looking at the detail of SWR shows small incremental changes which can build up to a useful result, second that there is little doubt I was not using the best ferrite for the job.
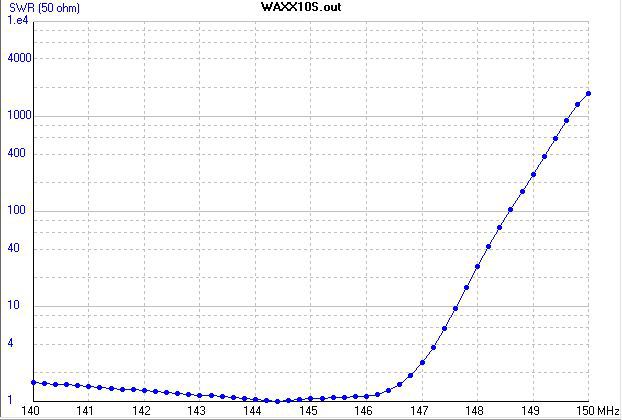
After installing the ferrite choke, it wasn’t long until some more rain came along. The plot below shows the SWR of a WAXX9S 144MHz beam, wet and dry. The pattern has shifted nearly one Mhz low frequency when wet (the bold line). Because the curve is quite flat, most of the 2m band is still in an area where the SWR is below 1.5 to 1. The important frequencies for me are around 144.1 for EME, 144.3 for DX and contesting and up to 144.5 for beacon checks. In that area, the SWR is below 1.2 to 1, wet or dry. It looks like I’ll be building four of these for the EME array.

In addition to rain, snow and frost can affect the SWR. I anticipate that snow will have a significant affect, but there are not many days of snow here in the south-east UK, so I’ll put up with whatever happens. Frost is quite frequent and it will be interesting to see how the aerial behaves.
Very recently I have had the ability to use a data logger to record SWR over a period of time. This is thanks to DG8SAQ, who has provided me with a beta copy of additional software for the VNWA. So, just for fun, here is a plot of return loss against time, as a heavy squally shower came across. It’s clear how RL quickly reacts to rain falling on the aerial, and then reacts much more slowly as it dries out. This plot is atypical because it happens that the RL gets better when the aerial is wet – it was not an ideal frequency to monitor for a demonstration.

What about that excellent SWR reading shown in the beginning of this section ? Well, I confess to manipulating the result a little bit. I could have put a good 50ohm load on the analyser to get that reading but I didn’t. I could have put an attenuator in the feeder to cut down the reflected signal – I didn’t. But it really is a genuine reading from my aerial. When my mast is vertical, but fully nested, it is quite close to the house and garage. These have a small effect so I just rotated the aerial until I found a minimum reading. The lesson to take away from this is to carry out all tests with the aerial in the same position, pointing out over open ground.
In conclusion:-
- Getting a low SWR is not on its own particularly useful and it does not indicate that the aerial is resonant. Nevertheless it can give peace of mind when using a solid state amplifier.
- Getting the SWR low and with a pattern that matches predictions is useful because it provides confidence that gain is likely to match predictions too.
- When the aerial is dry, the best SWR should not be at the low end of the band. If it is, then when wet the aerial will not perform so well.
- Always try to make tests with the aerial in a place where it is not affected by local obstructions or reflections, and be consistent with the test location and equipment.
- Only make one change at a time and keep records of observations.